2015 ARTEMIS SCIENCE NUGGETS
Modeling CME-shock driven storms in 2012-2013: MHD-test particle simulations
by Mary K. Hudson
Dartmouth College
Introduction
ARTEMIS input was used for the 8 October 2013 storm simulation with much higher time resolution than nominally available from traditional solar wind monitors. ARTEMIS data from the Lunar outpost complement and enhance the measurements typically taken from the Advance Composition Explorer (ACE), WIND and now DSCOVR satellites at the Earth – Sun Langrange point (L1) where Earth's and Sun's gravity balance. The ACE data is generally available at one-minute time cadence from NASA's OMNIWeb, whereas the ARTEMIS data is available at higher (4s) time resolution when the moon is in the solar wind (75% of the time) from near-Earth distances which makes for a higher-fidelity input. The dual Van Allen Probes spacecraft have provided detailed observations of the energetic particles and fields environment for interplanetary shock driven storms in 2012 to 2013 which have now been modeled with MHD-test particle simulations. An abrupt decrease in the outer boundary of outer zone radiation belt electrons coincided with inward motion of the magnetopause for both 17 March and 8 October 2013 storms driven by Coronal Mass Ejections (CMEs) originating in the solar atmosphere, as was the case for storms observed shortly after launch (Hudson et al., 2014; 2015). Modeling magnetopause dropout events in 2013 with electric field diagnostics that were not available for storms immediately following launch has improved our understanding of the complex role that Ultra Low Frequency waves play in radial transport during such events.
Observations
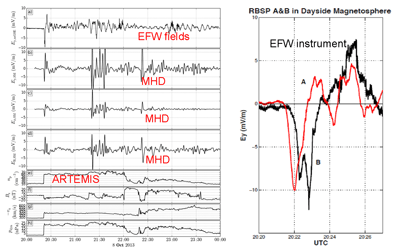
Figure 1 shows data from the ARTEMIS data (bottom 4 panels, left) the simulated azimuthal electric field amplitude along the track of the Van Allen Probes B spacecraft with that simulated using the Lyon-Fedder-Mobarry global MHD code coupled with the Rice Convection Model (2nd-4th panel, left) and compares them with data from the Electric Fields and Waves instrument (Wygant et al., 2013) on the Van Allen Probes spacecraft (right and top left panel). Figure taken from Hudson et al., 2015 and Foster et al., 2015.
| Figure 1. Left: a) Measured and b) Simulated Ey at Probe B during shock arrival and following 4 hours for 8 Oct 2013 CME shock event. Right: Delay between A&B Probes yields V~850km/s, bipolar Eφ due to magnetopause compression. |
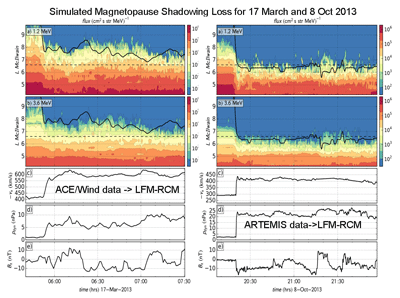
Figure 2 shows a comparison between simulated flux in two energy channels of the Relativistic Electron Proton Telescope (Baker et al., 2013) on the Van Allen Probes along with input solar wind data used for the MHD-test particle simulations for both the 17 March and 8 October 2013 CME-shock driven storms. Note the higher time cadence of the ARTEMIS data. The computed magnetopause location is indicated with the black line in the top two panels of both figures. Severe compression of the dayside magnetopause by the shock pushed it inside the orbit of geosynchronous spacecraft, indicated by the dashed line, in the case of the 8 October storm, with loss of electron flux to the magnetopause represented by the color scale. This process is now believed to be largely responsible for prompt dropout in outer zone radiation belt electron flux during these and other CME-shock driven storms observed since the launch of the Van Allen Probes in 2012 (Hudson et al., 2014; 2015).
| Figure 2. Simulated electron flux following electron guiding centers in LFM-RCM fields. Flux at two energies is shown: a) 1.2 and b) 3.6 MeV on 8 October 2012 beginning at 05:00 UT plotted vs. L, approximately radial distance in the equatorial plane in earth radii, and time. Solid line is computed magnetopause location and dashed line is geosynchronous orbit. Higher energy electrons (3.6 MeV) are confined to lower L than 1.2 MeV prior to shock arrival; both expand outward at later times suggesting ULF wave interaction. CME shock is evident in bottom three panels c) - e) which plot solar wind velocity, dynamic pressure and Bz propagated to the earth's bow shock from ACE and Wind data in the case of the March event and ARTEMIS for the October storm. The simulation model follows 1.6 million electron test particles. |
Conclusion
MHD-test particle simulations using measured solar wind input by the ARTEMIS spacecraft have matured to the point of capturing the global dynamics of CME-shock driven storms, in particular losses associated with magnetopause compression. Comparisons with empirical models of the magnetopause location show good agreement (Hudson et al., 2014). They also reproduce features of prompt acceleration, first tested against the observations for the March 1991 CME shock acceleration event, which was however much stronger than those seen so far in the current maximum in the Sun's eleven year sunspot cycle (Elkington et al., 2002). We now have dual spacecraft measurements from the Van Allen Probes available inside the magnetosphere, as well as continuous solar wind measurements of MHD input parameters that were not available for the March 1991 event, with ARTEMIS providing higher time resolution input available when usual sources such as ACE are not available. Further, we have the good fortune that both Van Allen Probes spacecraft were azimuthally separated on the dayside for the 8 October 2013 CME-shock event, allowing determination of azimuthal impulse propagation speed. With a pre-exiting hot electron population supplied by a 2 October 2013 CME-shock driven storm, conditions were optimum for observing drift resonant acceleration of electrons from the bipolar electric field impulse produced by magnetopause compression, as seen for March 1991 (Li et al, 1993). The 2013 event was much weaker than March 1991, where the azimuthal electric field was estimated to be of order 200 mV/m on the dayside (Wygant et al., 1994), vs. 10 mV/m for the 8 October 2013 storm (Foster et al., 2015). However, identical high-resolution (in energy and pitch angle) particle detectors along with three-component electric field measurements on dual spacecraft enable us to measure as well as model this type of prompt acceleration event in greater detail. The high time resolution of the ARTEMIS input data is also critical to capturing the shock-induced electric field impulse along the spacecraft trajectory on the dayside, which is comparable in the simulations (Ey ~ Eφ ~ 10 mV/m) to what was measured by the Electric Fields and Waves instrument (Hudson et al., 2015).
References
Baker, D. N., et al. (2013), The Relativistic Electron-Proton Telescope (REPT) Instrument on Board the Radiation Belt Storm Probes (RBSP) Spacecraft: Characterization of Earth's Radiation Belt High-Energy Particle Populations, Space Science Reviews, doi:10.1007/s11214-012-9950-9.Elkington, S. R., M. K. Hudson, M. J. Wiltberger, and J. G. Lyon (2002), Mhd/particle simulations of radiation belt dynamics, J. Atmos. Solar Terr. Phys., 64(5), 607–615.
Foster, J. C., J. R. Wygant, M. K. Hudson, A. J. Boyd, D. N. Baker, P. J. Erikson and H. E. Spence, Shock- induced prompt relativistic electron acceleration in the inner magnetosphere (2015), J. Geophys. Res., doi: 10.1002/2014JA020642.
Hudson, M. K., D. N. Baker, J. Goldstein, B. T. Kress, J. Paral, F. Toffoletto, and M. Wiltberger (2014), Simulated magnetopause losses and Van Allen Probe flux dropouts, Geophys. Res. Lett., doi:10.1002/2014gl059222.
Hudson, M. K., J. Paral, B. T. Kress, M. Wiltberger, D. N. Baker, J. C. Foster, D. L. Turner, and J. R. Wygant (2015), Modeling CME-shock-driven storms in 2012-2013: MHD test particle simulations, J. Geophys. Res.: Space Physics, 120, 2, doi:10.1002/2014ja020833.
Li, X., I. Roth, M. Temerin, J. R. Wygant, M. K. Hudson, and J. B. Blake (1993), Simulation of the prompt energization and transport of radiation belt particles during the March 24, 1991 SSC, Geophys. Res. Lett., 20(22), 2423–2426.
Wygant, J., F. Mozer, M. Temerin, J. Blake, N. Maynard, H. Singer, and M. Smiddy (1994),Large amplitude electric and magnetic field signatures in the inner magnetosphere during injection of 15 MeV electron drift echoes, Geophys. Res. Lett., 21(16), 1739–1742, doi:10.1029/94GL00375.
Wygant, J. R.b et al. (2013), The Electric Field and Waves Instruments on the Radiation Belt Storm Probes Mission, Space Science Reviews, Space Science Reviews, Volume 179, Issue 1-4, pp 183-220, , 201310.1007/s11214-013-0013-7, 2013.
Biographical Note
Mary Hudson is the Eleanor and A. Kelvin Smith Distinguished Professor of Physics at Dartmouth College, a Co-I on the NASA Van Allen Probes EFW and ECT teams as well as the Balloon Array for Radiation Belt Relativistic Electron Loses Mission of Opportunity and Co-chairs the NRC Committee on solar and Space Physics.
 Please send comments/suggestions to
Emmanuel Masongsong / emasongsong @ igpp.ucla.edu

