2020 ARTEMIS SCIENCE NUGGETS
Sequential observations of flux transfer events, poleward-moving auroral forms, and polar cap patches
by Kyoung-Joo Hwang
Southwest Research Institute
Introduction
The solar wind-magnetosphere coupling often occurs in a nonsteady manner. Such disturbances modify the magnetosphere-ionosphere system. One of the most common and important processes of such nonsteady phenomena is time-dependent dayside reconnection, as observationally evidenced by flux transfer events (FTEs), which have been, in turn, represented by ionospheric poleward-moving auroral forms (PMAFs). Decaying PMAFs have been often followed by the occurrence of polar cap patches, which are regions of plasma density enhancements observed in the polar cap. Although a portion of this link has been widely studied and reported, the complete sequence of these connections and full picture of the solar wind-dayside magnetopause-ionosphere coupling have rarely been reported and examined. Here, we use the data from ARTEMIS (for solar wind inputs), MMS (for dayside dynamics), ASI cameras (for PMAFs), radars and GPS (for polar cap patches and their propagation) to reveal the complete sequence.
|
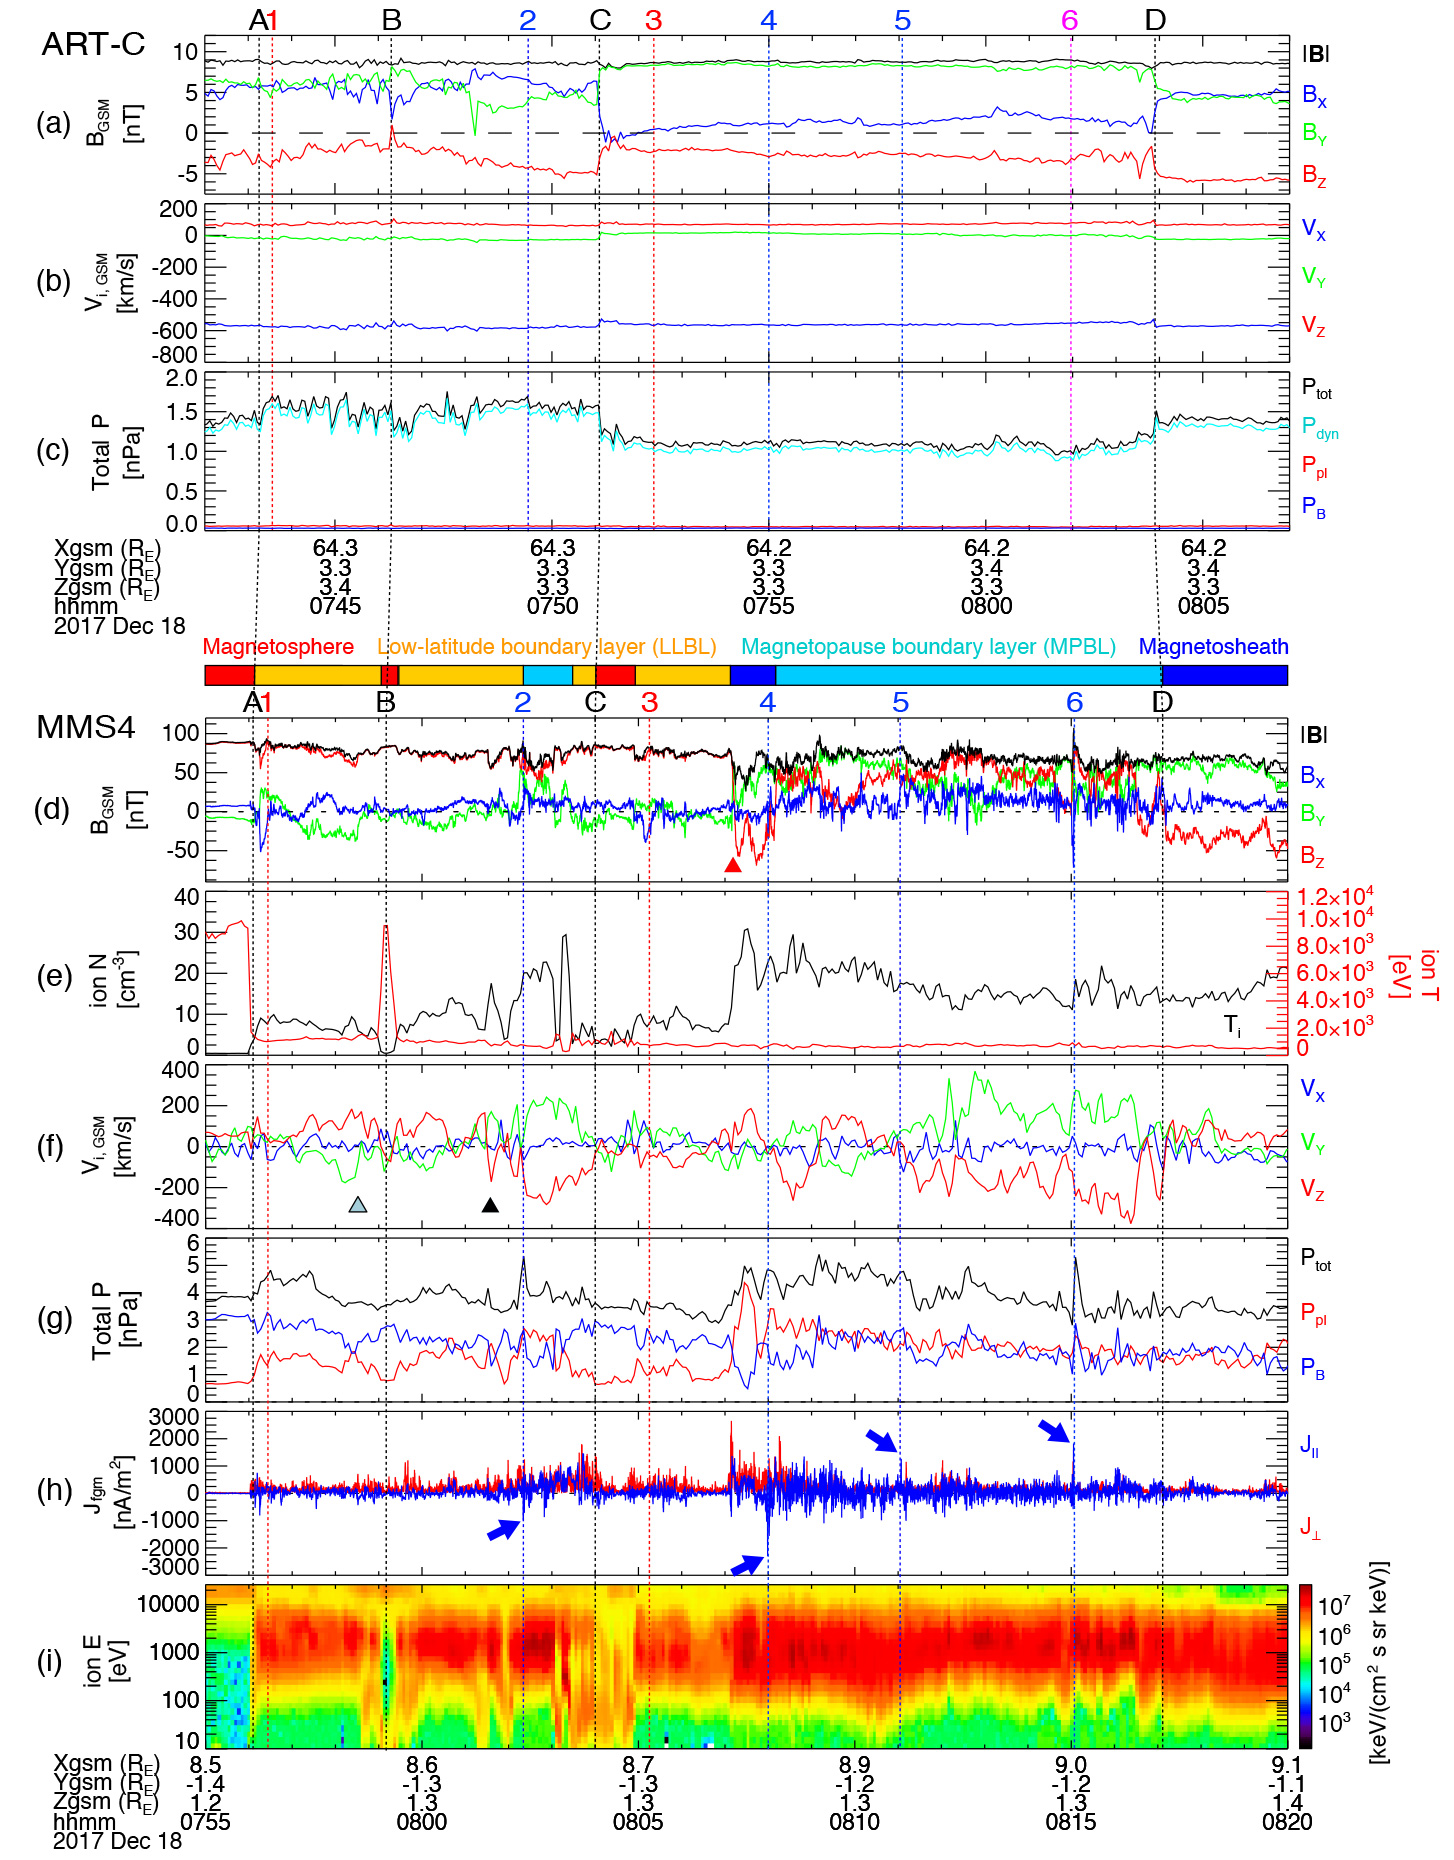
| Figure 1. Upper panels (ARTEMIS-C observations of the solar wind): (a) the x (blue), y (green), and z (red) components of the IMF, (b) solar wind velocity, and (c) total (black profiles in panel c), dynamics (cyan), plasma (red), and magnetic (blue) pressures. Lower panles (MMS4 observations of the dayside magnetopause boundary layers): (d) x (blue), y (green), and z (red) components of the magnetic field (B); (e) ion density (black) and temperature (red); (f) ion bulk velocity; (g) plasma (red) and magnetic (blue) pressures, and the sum of plasma and magnetic pressures (black); (h) current density decomposed into parallel (blue) and perpendicular (red) components to B; (i) ion energy spectrogram. All the vector parameters in Figure 1 are shown in Geocentric Solar Magnetospheric coordinates (GSM). |
Results
Figure 1 shows ARTEMIS observations (a-d) of upstream solar wind conditions and MMS observations (d-i) of the dayside magnetopause boundary layer. A relatively steady solar wind velocity (-550 km/s; Figure 1b) suggests a transit time for the solar wind from ARTEMIS located at [64.2, 3.3, 3.3]RE to MMS at [8.0, -1.2, 1.3]RE to be ~13 minutes based on the best correlation between the two-point measurements. Multiple changes in solar wind dynamic pressure (Figure 1c) caused MMS to cross multiple magnetopause boundary layer as denoted by vertical dotted black lines, ‘A’ to ‘D’ in Figure 1, together with red, orange, light blue, and blue bars indicating different near-magnetopause regions at the top of Figure 1(d). Note a series of localized magnetic strength enhancements (marked by vertical dashed blue lines ‘1’ to ‘6’ at the top of Figure 1d) with bipolar changes in Bx. These magnetic field perturbations are most likely arising from the overall motion of a southward-moving FTE drifting along the magnetopause. Four-spacecraft timing analysis indicates that most of the FTEs propagated southward and duskward, consistent with Cooling et al., (2001)’s predictions. This model also predicts northward/dawnward-moving FTEs to be counterparts to the southward/duskward-moving FTEs.
|
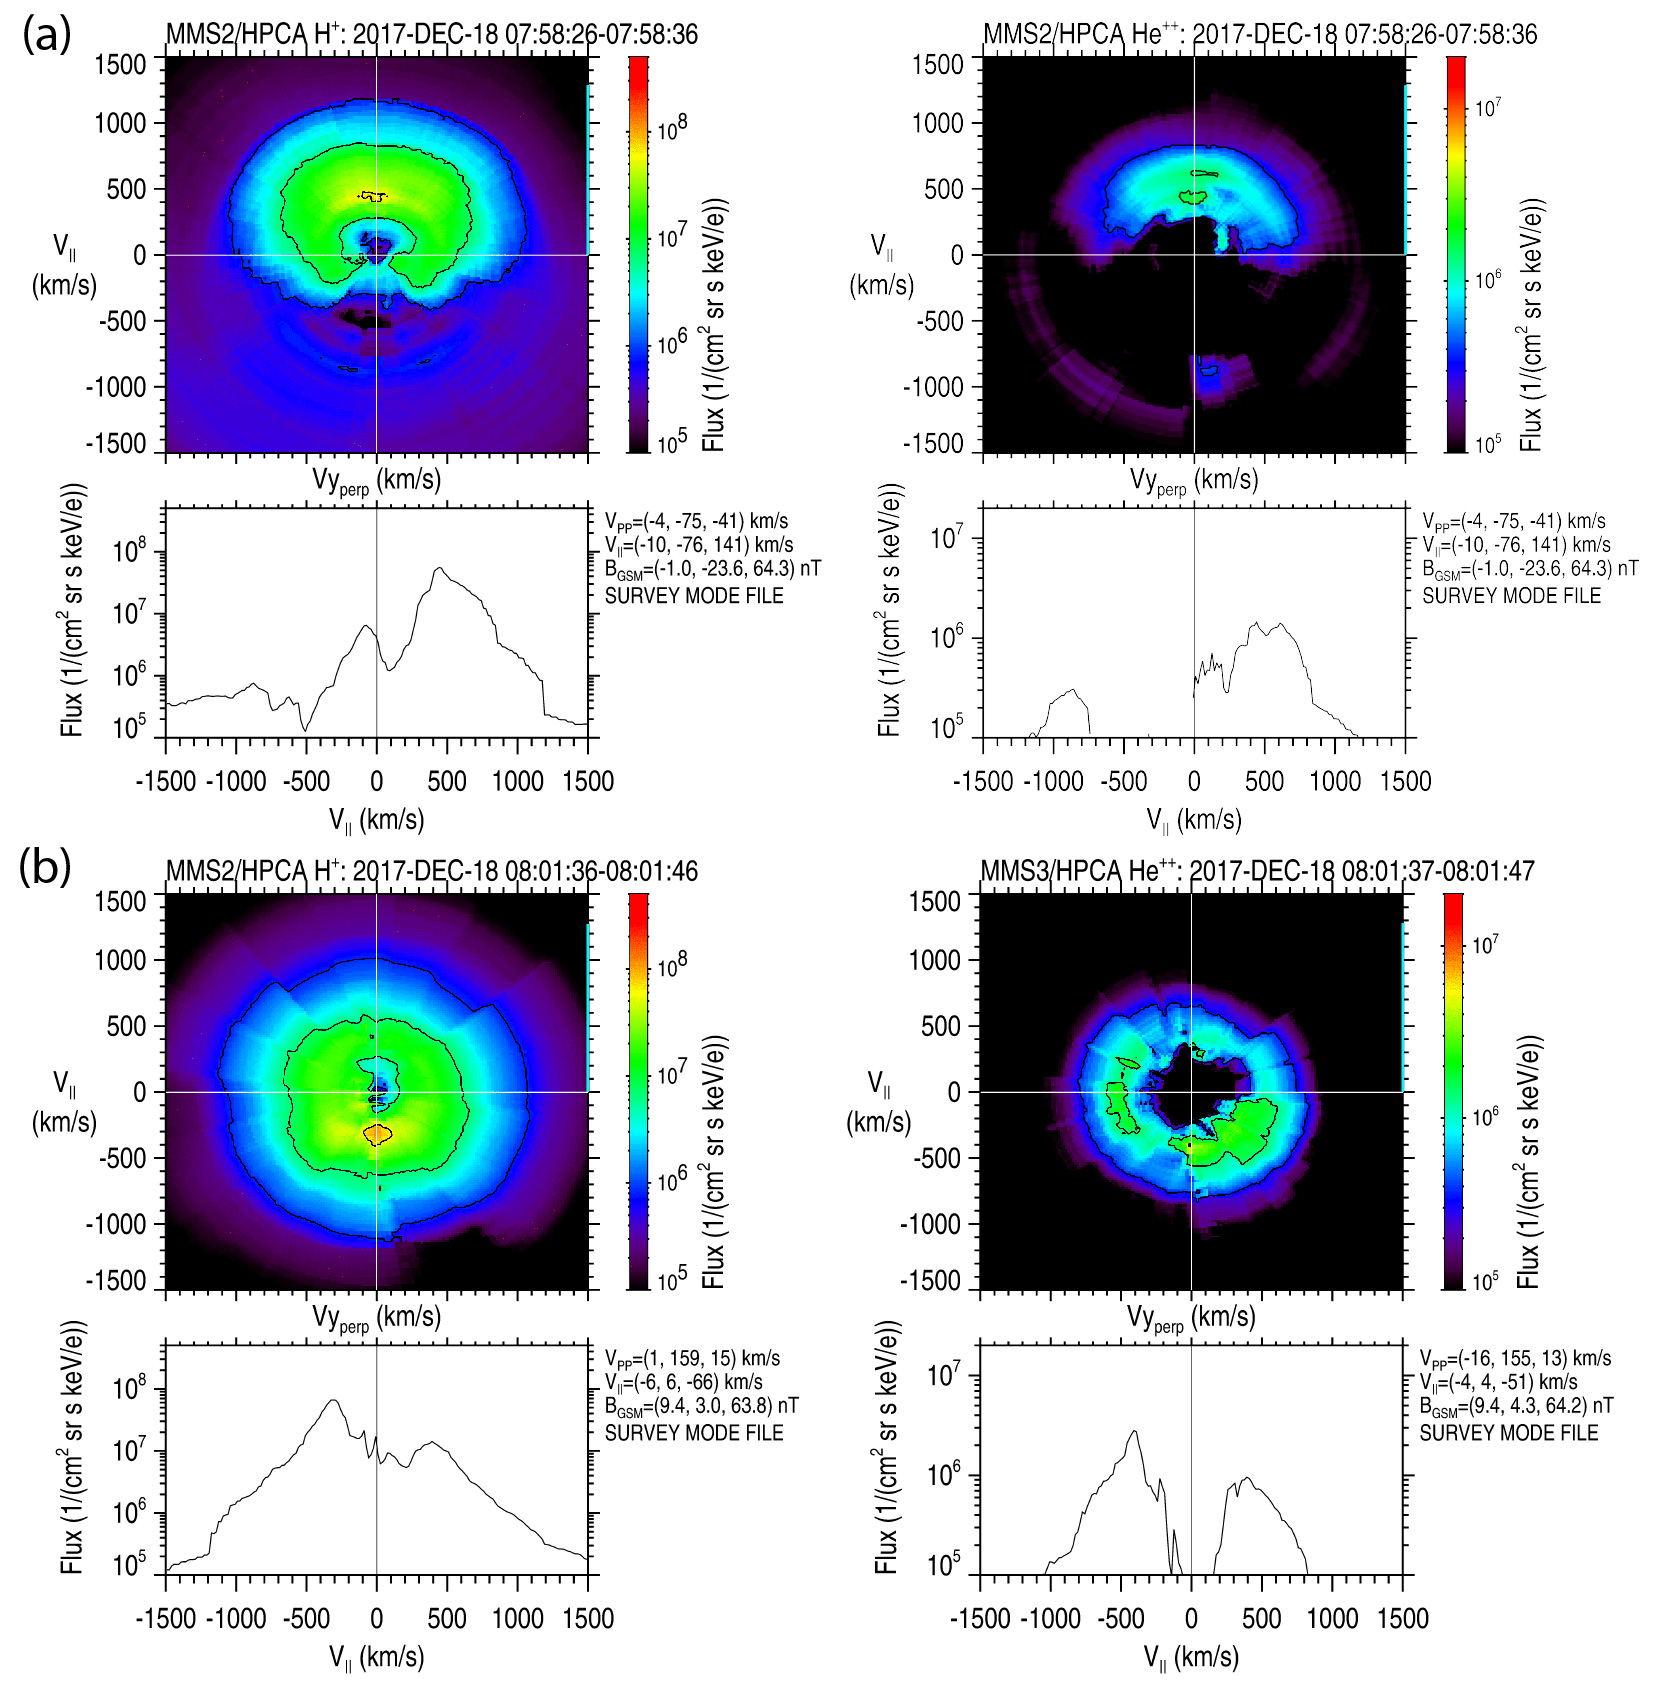
| Figure 2. MMS/HPCA observations of H+ (left panels) and He2+ (right panels) distributions in the frame of reference where V⊥ = 0 for two selected times (marked by triangles in Figure 1f). For each panel, the upper plot shows 2-D (V∥, V⊥) distributions and the lower one shows a 1-D cut of the 2-D distributions along V⊥ = 0. |
Figure 2 shows H+ (left panels) and He2+ (right panels) distributions for two selected times (marked by triangles in Figure 1f) during a low-latitude boundary layer crossing. While H+ distributions can show mixed ions of magnetosheath or magnetosphere origin, He2+ distributions represent the magnetosheath population entered from a reconnection site, located below (a) or above (b) the spacecraft. This observation together with overall large-scale fluctuation in ±Vi,z (±Vi,y) (Figure 1f), reconnection jet signatures across the magnetopause, and flow reversals around FTEs, indicate the spatial variation of a (dominant) X-line in time, rather than repeated, complete turn-on-and-off of dayside reconnection. Considering continuously on-going reconnection, the observed FTEs signatures, '1'to '6' are, then, likely to be associated with temporal modulation (i.e., intensification) of the reconnection rate during continuous, either a single or multiple X-line reconnection.
|
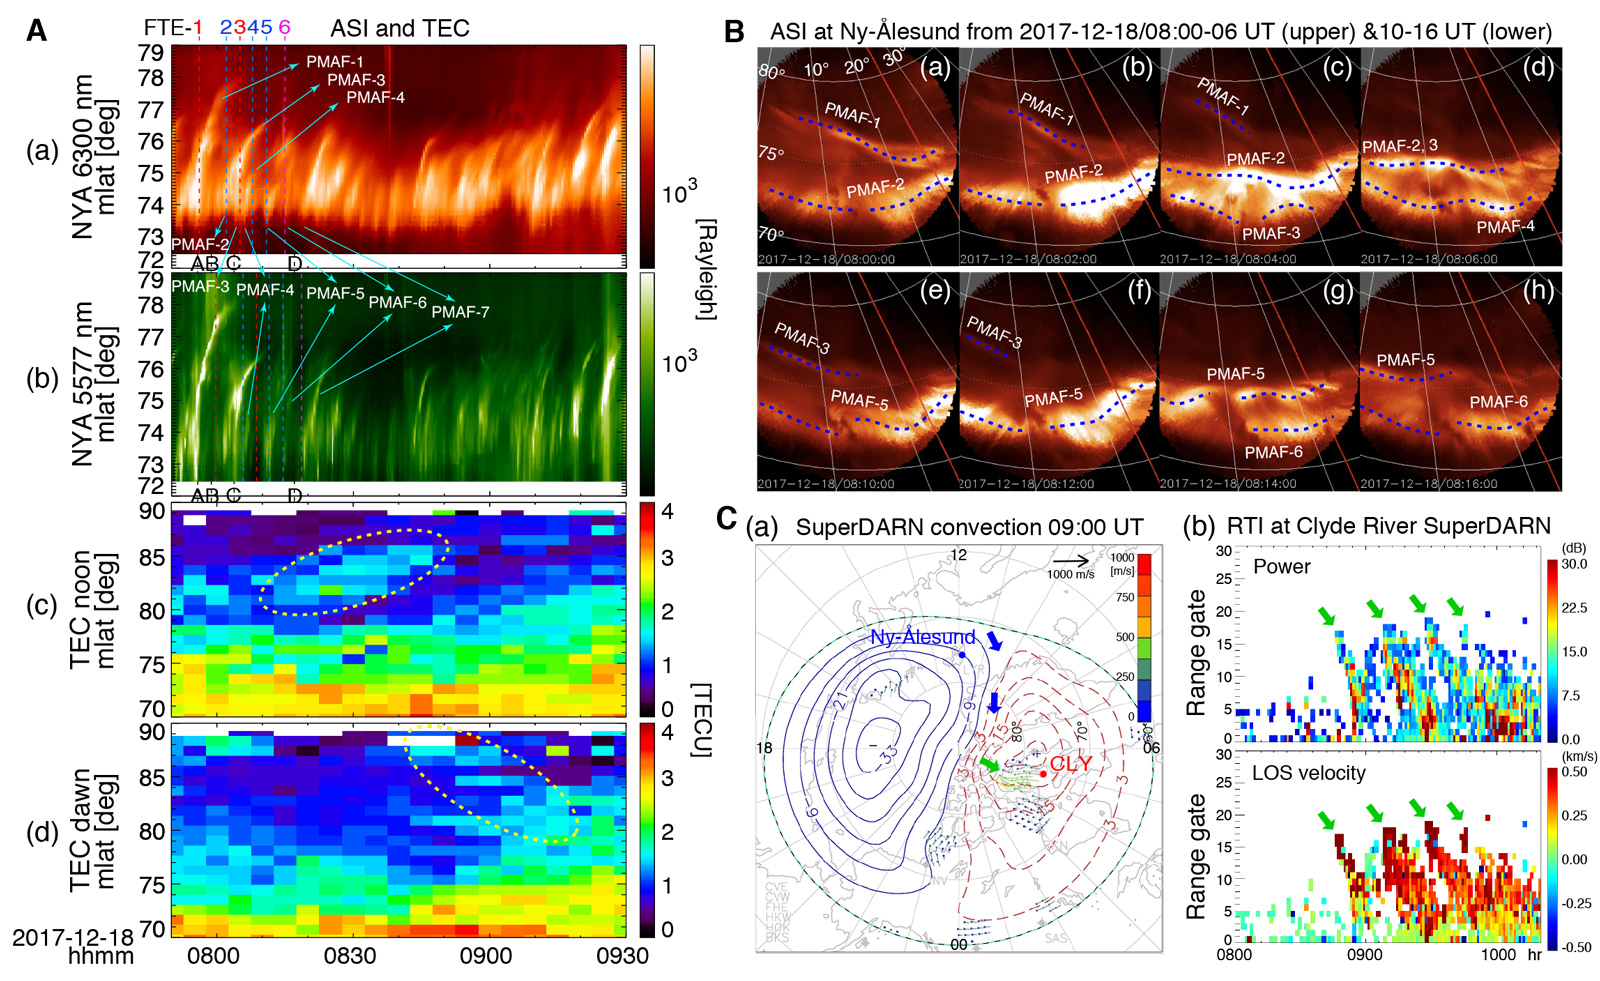
| Figure 3. A. (a, b) south-to-north keograms of 630.0 nm and 557.7 nm wavelength ASI emissions, respectively, recorded at Ny-Ålesund (78°55'30"N 11°55'20"E); (c, d) south-to-north keograms of median TEC measurements at the noon sector (09-15 UT) and at the dawn sector (03-09 UT). B. Times series of ASI at Ny-Ålesund during 0800-0808 UT (a-d; upper panels) and 0810-0818 UT (e-h; lower panels). C. (a) SuperDARN convection map at 0900 UT; (b) the range-time-intensity (RTI) of the received power (upper panel) and line-of-sight (LOS) velocity (lower) as a function of time and range gate along beam 2 of the Clyde River SuperDARN (70.49°N and longitude -68.5°E). |
This combined continuity and transiency of dayside dynamics are consistent with ionospheric signatures of auroral brightening recorded at Ny-Ålesund (78°55'30"N 11°55'20"E) in Svalbard, Norway, near the MMS4 footprint (Figure 3Aa-b and 3B). A series of PMAFs are identified by a few to several-minute long bursts propagating northward. FTE-'1' to '6' show good correlations with PMAF-1 to -6 as denoted by cyan arrows in Figure 3A(a). They persisted during the entire period shown in Figure 1(d-i), but showed an intensification, followed by a poleward/dawnward motion (Figure 3B) correlated with each of the observed FTEs. This strongly suggests a one-to-one correspondence between dayside transients and ionospheric PMAFs.
The decaying intensity of PMAFs has often been followed by the occurrence of polar cap patches. Figures 3A(c) shows weak (~1.5 TECU) poleward-moving electron density enhancements (dashed ellipse in Figure 3Ac) starting at ~0820 UT after decaying of PMAFs-1 to 6. Consecutively after 0845 UT, electron density enhancements of a similar intensity are shown at the dawn sector (dashed ellipse in Figure 3Ad). They move dawnward at ~430 m/s until ~0915 UT. Figure 3C(b) shows that between ~0900 and 1000 UT patch-like structures moved towards the radar. Based on the Clyde River radar location, these structures correspond to dawnward return flows over the polar cap. Therefore, it is likely that patches generated around the dayside cusp after ~0815 UT have convected across the polar cap and were observed by Clyde River at ~0900-1015 UT.Conclusion
The solar wind-magnetosphere-ionosphere interactions under significant variations of the solar wind dynamic pressure are reported via observations of a series of FTEs at the dayside magnetopause boundary layers and corresponding PMAFs in the northern high latitude ionosphere that are followed by the formation of patch-like plasma density enhancements moving poleward and then dawnward. The response time between FTEs and PMAFs is likely to be the Alfvén transit time for the effects of reconnection to propagate from the dayside reconnection site to the ionosphere along the geomagnetic field. The delay is mostly within a few minutes in this event. The response time between dayside FTEs (first FTE signature) and the start and end times of a patch’s transpolar transit is estimated to be ~15 min and ~75 min, respectively. The 15 min might correspond to the response time for the polar cap to restore its equilibrium with the addition of newly open flux resulting from pulsed dayside reconnection (the modulation in the reconnection rate in this event).
References
Hwang, K.-J., Y. Nishimura, A. J. Coster, R. Gillies, R. C. Fear, et al. (2020), Sequential observations of flux transfer events, poleward-moving auroral forms, and polar cap patches, J. Geophys. Res., 125, e2019JA027674. https://doi.org/10.1029/2019JA027674Cooling, B. M. A., C. J. Owen, and S. J. Schwartz (2001), Role of the magnetosheath flow in determining the motion of open flux tubes, J. Geophys. Res., 106, 18,763–18,776, doi:10.1029/2000JA000455
Biographical Note
Kyoung-Joo Hwang (going by Joo Hwang) is a Staff Scientist at Southwest Research Institute in San Antonio, TX. She received a Ph.D. in Space Plasma Physics from Dartmouth College. Her current research focuses on understanding multi-scale fundamental physical processes occurring in the near-Earth space environment including Earth’s ionosphere, magnetosphere, and magnetosheath.
 Please send comments/suggestions to
Emmanuel Masongsong / emasongsong @ igpp.ucla.edu
Please send comments/suggestions to
Emmanuel Masongsong / emasongsong @ igpp.ucla.edu