2020 ARTEMIS SCIENCE NUGGETS
Simultaneous ARTEMIS Two-Point Observation of Earthward and Tailward Reconnection Exhaust Flows in the Earth's Midtail
by Chih-Ping Wang
UCLA Atmospheric and Oceanic Sciences
Introduction
Fast flows within the plasma sheet with speeds of several hundreds of km/s are often observed in the Earth's magnetotail current sheet. These fast flows can be directed either earthward or tailward and have been explained as consequences of magnetic reconnection. While there have been numerous studies in the fast flows and reconnection in the near‐Earth tail, investigation of midtail reconnection remains limited. Here we present a unique event with the two ARTEMIS satellites simultaneously observing earthward and tailward fast flows in the midtail at X ~ -63 RE. We evaluate magnetic reconnection as a responsible mechanism by comparing the spacecraft observations with a particle‐in‐cell (PIC) simulation (Wang et al., 2020).
|
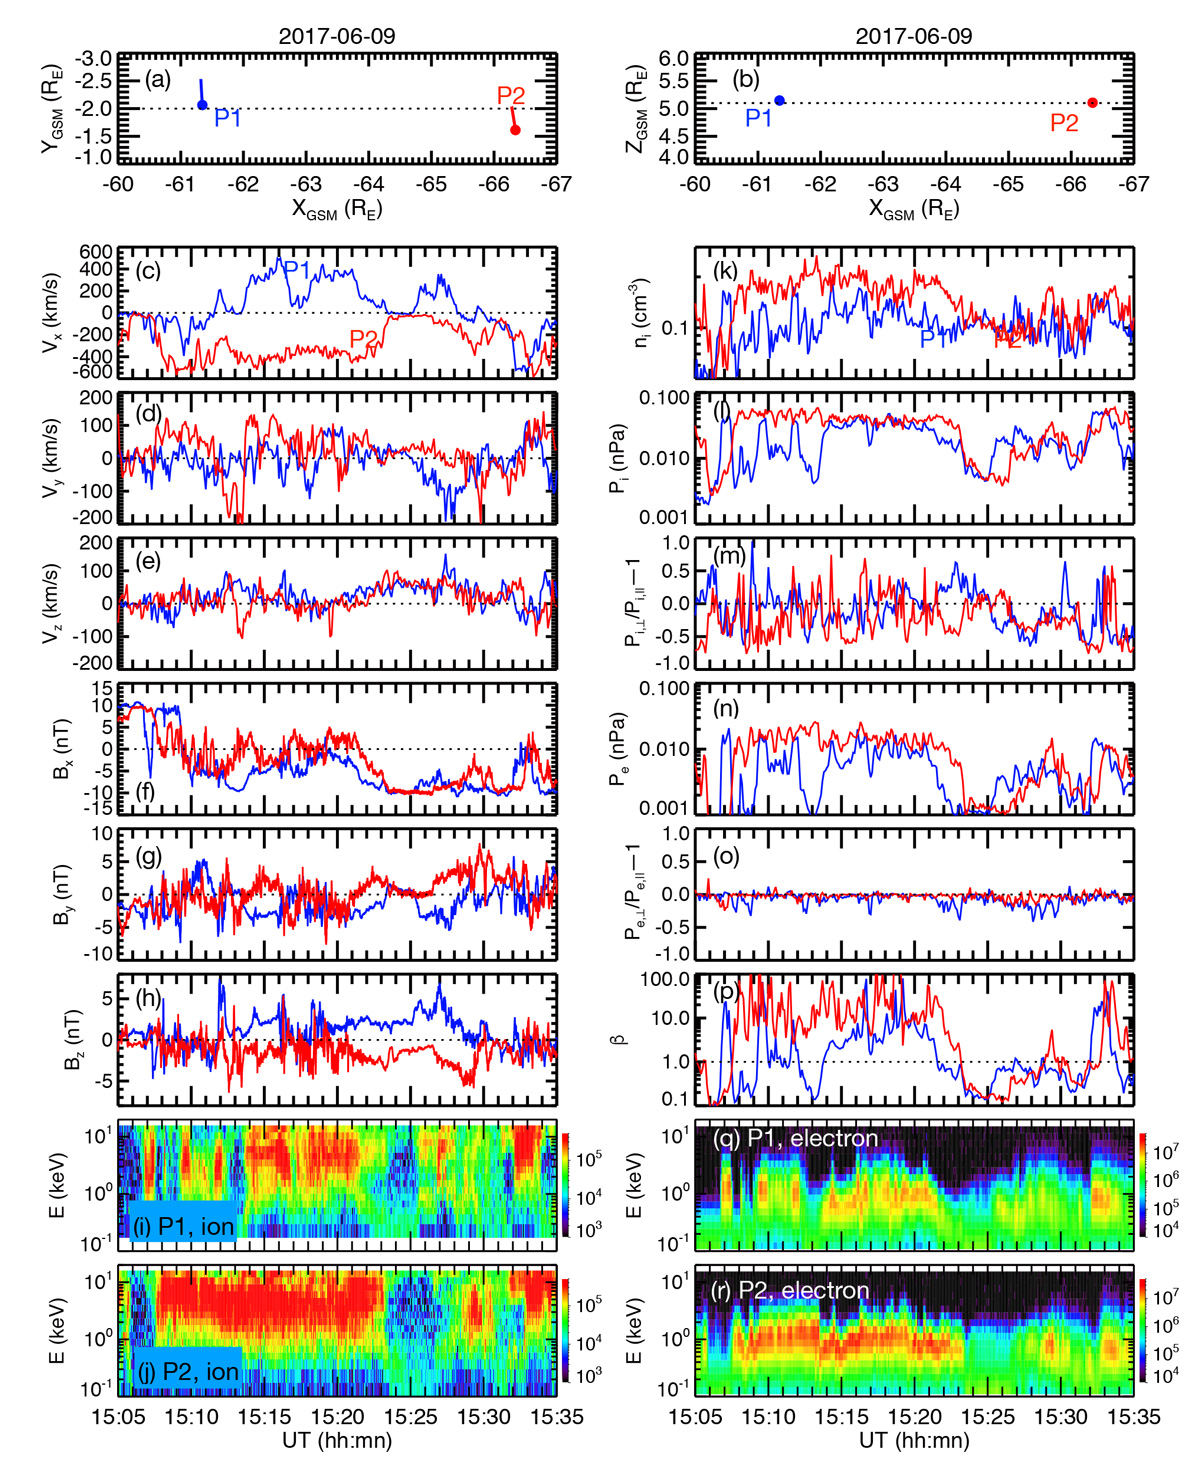
| Figure 1. Overview of the event on 9 June 2017. The locations of P1 and P2 in (a) X‐Y and (b) X‐Z planes. Temporal profiles of ion bulk velocity components (c) Vx, (d) Vy, and (e) Vz; the magnetic field components (f) Bx, (g), By, and (h) Bz observed by P1 (blue) and P2 (red). The energy spectrum of ion energy fluxes (eV/(cm ‐s‐sr‐eV) observed by (i) P1 and (j) P2. Temporal profiles of (k) ion density, (l) ion pressure, (m) ion pressure anisotropy, (n) electron pressure, (o) electron pressure anisotropy, and (p) plasma beta observed by P1 (blue) and P2 (red). The energy spectrum of electron energy fluxes (eV/(cm ‐s‐sr‐eV) observed by (q) P1 and (r) P2. |
Results
Figure 1 shows the fast flow event observed on 9 June 2017. As shown in Figures 1a and 1b, ARTEMIS P1 and P2 were in the midtail near midnight, separated mainly along the X direction with P1 being ~5 RE earthward of P2. Figures 1c to 1e show that P2 (red lines) observed tailward flows (peak speeds of ~500 km/s) throughout the event, while P1 (blue lines) first observed tailward flows, then earthward flows from 15:11 to 15:28 UT, and then tailward flows afterward. The flow direction changes observed by P1 were likely a result of a reconnection x line moving past P1, and these fast flows in opposite directions observed simultaneously by P1 and P2 from 15:11 to 15:24 UT were likely the reconnection exhaust coming out from the reconnection site located between P1 and P2. As indicated by the magnetic fields shown in Figures 1f–1h and the ion (Figures 1i and 1j), and electron (Figures 1q and 1r) energy spectrum, during the intervals of fast flows, both P1 and P2 were in the vicinity of the current sheet. Figures 1f–1h show enhanced magnetic field fluctuations within the fast flows. The ion and electron pressure anisotropy (Ap ≡ V⊥/V∥-1) shown in Figures 1m and 1o, respectively, indicates that the ion pressures were highly anisotropic, while the electron pressures were relatively isotropic. Current sheet flapping and strong compressional waves were observed within the fast flows around local proton gyrofrequencies, which were likely a result of the firehose instability driven by the strong pressure anisotropy generated by magnetic reconnection.

|
| Figure 2. The spatial distributions of the simulated parameters in the L‐N plane from the PIC simulation at t = 225. (a) The θ angle (color contours) and magnetic field lines (blue lines). The two black stars indicate the location of the two x lines. (b) Ion density. (c) Ion and (d) temperatures. (e) Plasma pressure. (f) The firehose parameter ε. (g–i) Ion bulk velocity components. (j–l) Electron bulk velocity components. (m–o) Magnetic field components. (p–r) Current density components. (s–u) Electric field components. The two vertical dotted lines indicate the two L locations, L = 40 and −65, where the parameters are plotted in Figures 3q–3x. |
To verify that the above observed fast flows were indeed the reconnection exhausts, we compare the observed ion and electron plasma moments and magnetic and electric fields with a large‐scale PIC reconnection simulation (Liu et al., 2012). Figure 2 shows the spatial distributions in the L‐N plane for several key plasma and field parameters from the PIC reconnection simulation at t = 225 (the positive L is in the direction of the lobe field pointed toward the Earth; the N is the direction perpendicular to the current sheet plane with the positive N pointed toward the northern lobe, and the M completes the coordinates). The color contours of Figure 2a show magnetic field inclination angle θ ≡ tan (BMN/|BL|). θ changes sharply from < 0° in the inflow region to >10° within the exhaust with θ ~ 10° in the separatrix. Figures 2b to 2e show that reconnection increases number density, temperatures, and pressures from the inflow to the exhaust. These parameters vary with |L|. The firehose instability parameter, ε = 1– (Β||– Β⊥)/2 (ε < 0 indicates firehose unstable) shown in Figure 2f shows that large pressure anisotropy is developed near the current sheet (indicated by the black curve). Figures 2g to 2l show that for |VL| is the dominant component in both ion and electron bulk velocities. Figure 2j shows that the direction of Ve,L around the separatrix is opposite of that within the exhaust, associated with the Hall quadrupole fields. Figure 2n shows that BM has a quadrupole distribution, and Figure 2o shows BN is positive (negative) within the earthward (tailward) flows. Figures 2p to 2r show that JL is the dominant component in current densities. Figures 2s to 2u show that EN is the dominant electric field arising from the convection of the Hall quadrupole field by the outflows.
|
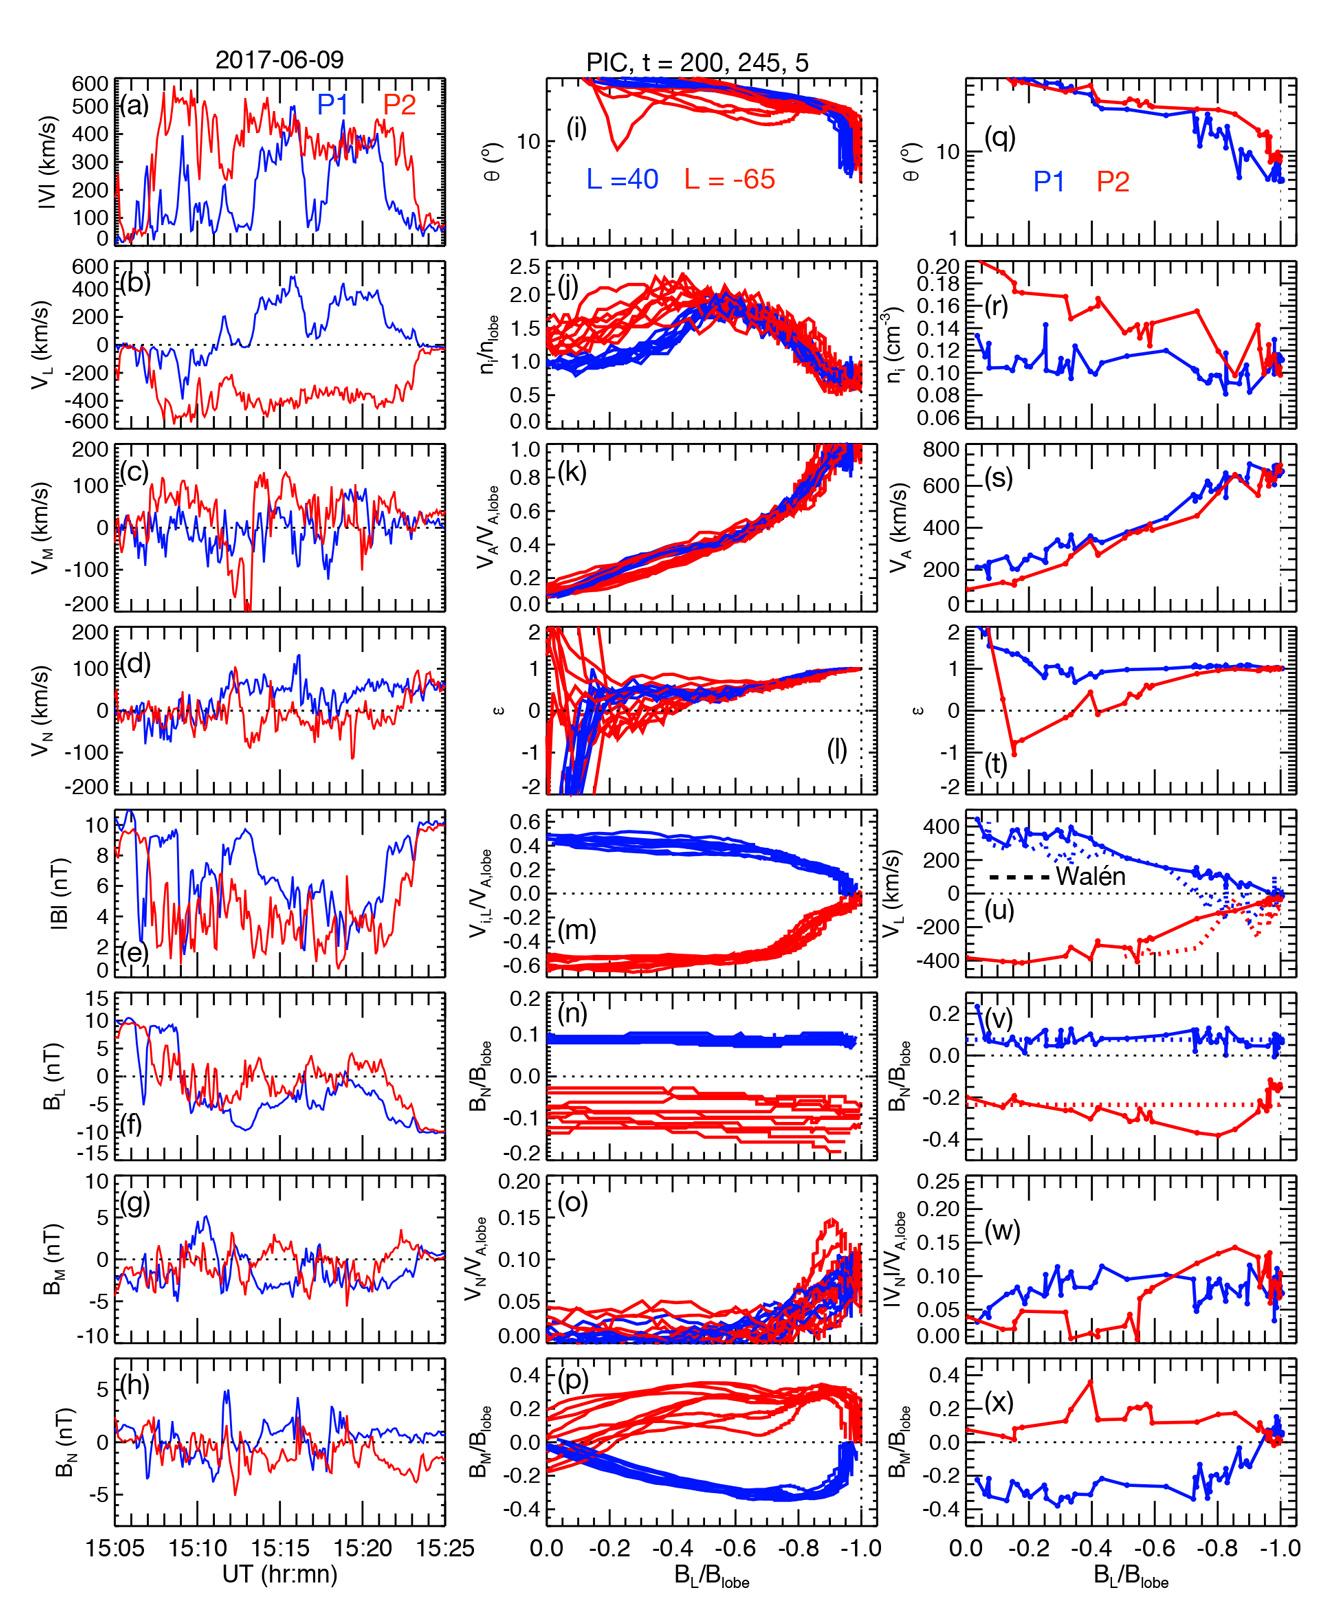
| Figure 3. (a–h) Temporal profiles of the ion bulk flow speed, VL, VM, VN, magnetic field strength, BL, BM, and BN observed by P1 (blue) and P2 (red). The simulated (i) θ angle, (j) ion number density, (k) Alfvén speed, (l) the firehose parameter, ε, (m) VL/VA,lobe, (n) BN/Blobe, (o) VN/VA,lobe, and (p) BM/Blobe as a function of BL/Blobe at L = 40 (blue) and −65 (red) (indicated by the two vertical dotted lines in Figure 2) for every five time units from t = 200 to 245. The same parameters from the observations are plotted in (q)–(x) for P1 from 15:19 to 15:25 UT (blue) and for P2 from 15:21:30 to 15:25 UT (red). The dotted lines in (u) indicate the predicted VL from the equation 1. |
The temporal profiles of the flow velocities and magnetic fields in the L‐M‐N coordinates are shown in Figures 3a-3h. Figures 3i to 3m show the PIC simulation results as a function of BL/Blobe for θ, number density, local Alfvén speed, ε, and VL, respectively, at L = 40 (blue) and L = −65 (red) for every five time units from t = 200 to 245. To compare with the simulated profiles shown in Figures 3i to 3m, we plot in Figures 3q to 3t the observed θ, number density, local Alfvén speed, ε, and VL profiles observed by P1 (blue) from 05:19 to 05:25 UT and by P2 (red) from 05:21:30 to 05:25 UT as a function of BL/Blobe. The observed variations with |BL| are qualitatively similar to the simulation profiles. The observed θ increase sharply with decreasing |BL| from <10° near the lobe to >10° within the fast flow. This 10° transition angle is basically the opening angle of the exhaust, and it suggests a normalized reconnection rate around ~ 0.17 (Liu et al., 2017). The local VA decreased from ~650 km/s in the lobe to ~200 km/s in the current center. Number densities increased from ~0.1 cm-3 in the lobe to ~0.14 and 0.2 cm-3 for P1 and P2, respectively, in the current sheet center. Plasma pressure was quite isotropic in the lobes (ε ~1) at both P1 and P2. The P2 pressure became more anisotropic with decreasing |BL| and was lower than the ε = 0 threshold near the current sheet, while P1 pressure remained ε > 0. To test the observed fast flows with the Walén relation, we use the observed ε, densities, and BL in the equation 1 to predict exhaust flow speeds. The predicted VL profiles are plotted with dotted lines in Figure 3u, and the reasonable consistency with the observed VL indicates the fast flows in this event were the reconnection exhaust.
Conclusion
In this study, we investigate the midtail reconnection by analyzing a unique simultaneous two-point measurements of fast earthward and tailward flows in midtail. The observed flows being the reconnection exhaust are supported by the flows on the two sides of the x line carrying opposite magnetic fluxes (northward for the earthward flow and southward for the tailward flow), satisfactory test of the Walén relation for the fast flow speeds, and qualitative/quantitative agreements between the observations and a large‐scale 2‐D PIC simulation of magnetic reconnection in several key reconnection signatures, including the reconnection rates, Hall fields, counterstreaming electrons, and plasma heating.
References
Liu, Y.‐H., Drake, J. F., Swisdak, M. (2012). The structure of the magnetic reconnection exhaust boundary. Physics of Plasmas, 19(2), 022110. https://doi.org/10.1063/1.3685755Liu, Y.‐H., Hesse, M., Guo, F., Daughton, W., Li, H., Cassak, P. A., Shay, M. A. (2017). Why does steady‐state magnetic reconnection have a maximum local rate of order 0.1? Physical Review Letters, 118(8), 085101. https://doi.org/10.1103/PhysRevLett.118.085101
Wang, C.‐P., Liu, Y.‐H., Xing, X., Runov, A., Artemyev, A., Zhang, X. (2020). An event study of simultaneous earthward and tailward reconnection exhaust flows in the Earth's midtail. Journal of Geophysical Research: Space Physics, 125, e2019JA027406. https://doi.org/10.1029/2019JA027406
Biographical Note
Chih-Ping Wang is a Researcher in Dept. of Atmospheric and Oceanic Sciences at UCLA. His main research interests are the Earth's magnetotail dynamics, particle sources and transport within the plasma sheet, the low-latitude boundary layer, the magnetosphere-ionosphere coupling, ring current physics, ULF waves, and reconnection.
 Please send comments/suggestions to
Emmanuel Masongsong / emasongsong @ igpp.ucla.edu
Please send comments/suggestions to
Emmanuel Masongsong / emasongsong @ igpp.ucla.edu