Instruments
Caveats
Low frequencies: When possible, it is always preferable to use timeseries data rather than power spectra. Since the FFT data is only available during burst modes when high-resolution timeseries data is also available (at least 128 samples per second for 2007-2009), timeseries data (EFW, EFP, SCW, SCP) should generally be used instead of FFT data for any frequency below 64 Hz.
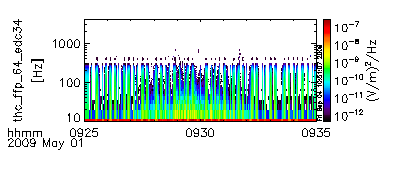
EFI eclipse season: The probe orbits and attitudes are optimized for data collection during the summer and winter months. During the spring and fall, the EFI probes pass through the shadow of the spacecraft. This results in a spike in the EFI data that appears twice per spin (i.e. every 1.5 s) in both the timeseries data (EFP, EFW) and in the spectral data (FBK, FFT). The spectral content of the spike is limited to below about 300 Hz. For the FBK data, the time resolution is typically less than 1.5 seconds, so the result is an increased noise floor in the lower-frequency bands. For the FFT data, the spikes appear as repetitive bands extending up to 300 Hz (see below). The SCM data are unaffected by this problem.

Figure 1: Noise generated
by the spacecraft eclipsing the EFI probes. The vertical bars up to 300
Hz are created by the eclipse spikes. The broadband signal
apparent behind the noise from about 09:27 to 09:32 is real.
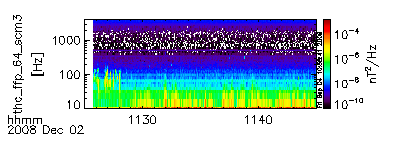
SCM noise floor: The SCM instrument noise floor is usually visible in the FFT and FBK data. The noise floor drops off as a power law out to about 1 kHz, and then rises again at the highest frequencies (see Figure 2). Le Contel et al [2009] discuss the SCM noise floor in more detail. The EFI noise floor is set by the quantization noise, and is generally not apparent in the FBK and FFT data.
Interference lines: Interference lines can be seen during quiet intervals, especially in the SCM data. Although the interference line amplitudes in the Themis data are small, the user should always beware of any lines that occur with constant frequency and amplitude. Known interference lines occur at 8, 32, 64, 96, 348, 500 and 1000 Hz. Lines have also occasionally been seen at other frequencies (144 Hz, 220 Hz).

Figure 2:
Noise floor and interference lines in the SCM data.
The noise floor can be seen throughout most of the interval as a smooth
noise which gradually falls up to about 500 Hz, is then flat until
about 2 kHz and finally rises again from 2 kHz to 4 kHz.
Constant lines at 32, 64, 96, 348 and 500 Hz are known
interference lines. The bursts of activity from 30-100 Hz
near the beginning of the interval are whistler waves.
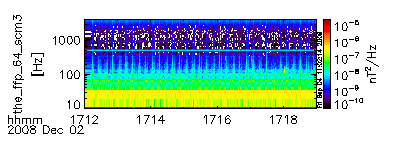
Spin-synchronous spikes in the SCM data: There are occasionally spin-synchronous spikes from the SCM instrument. When seen in the FFT data, the spikes may beat with the window in which the FFT data are collected to create repetitive intervals of apparent broadband noise (Figure 3).

Figure 3: Spin-synchronous noise in the SCM data. The spikes occur twice per spin, but then
beat with the 1 second interval of the FFT to produce a pair of
vertical bars every 12 seconds. Also note the strong 500
Hz interference during this interval.


